Project Gallery


Interactive Data Visualization and Analytics Platform
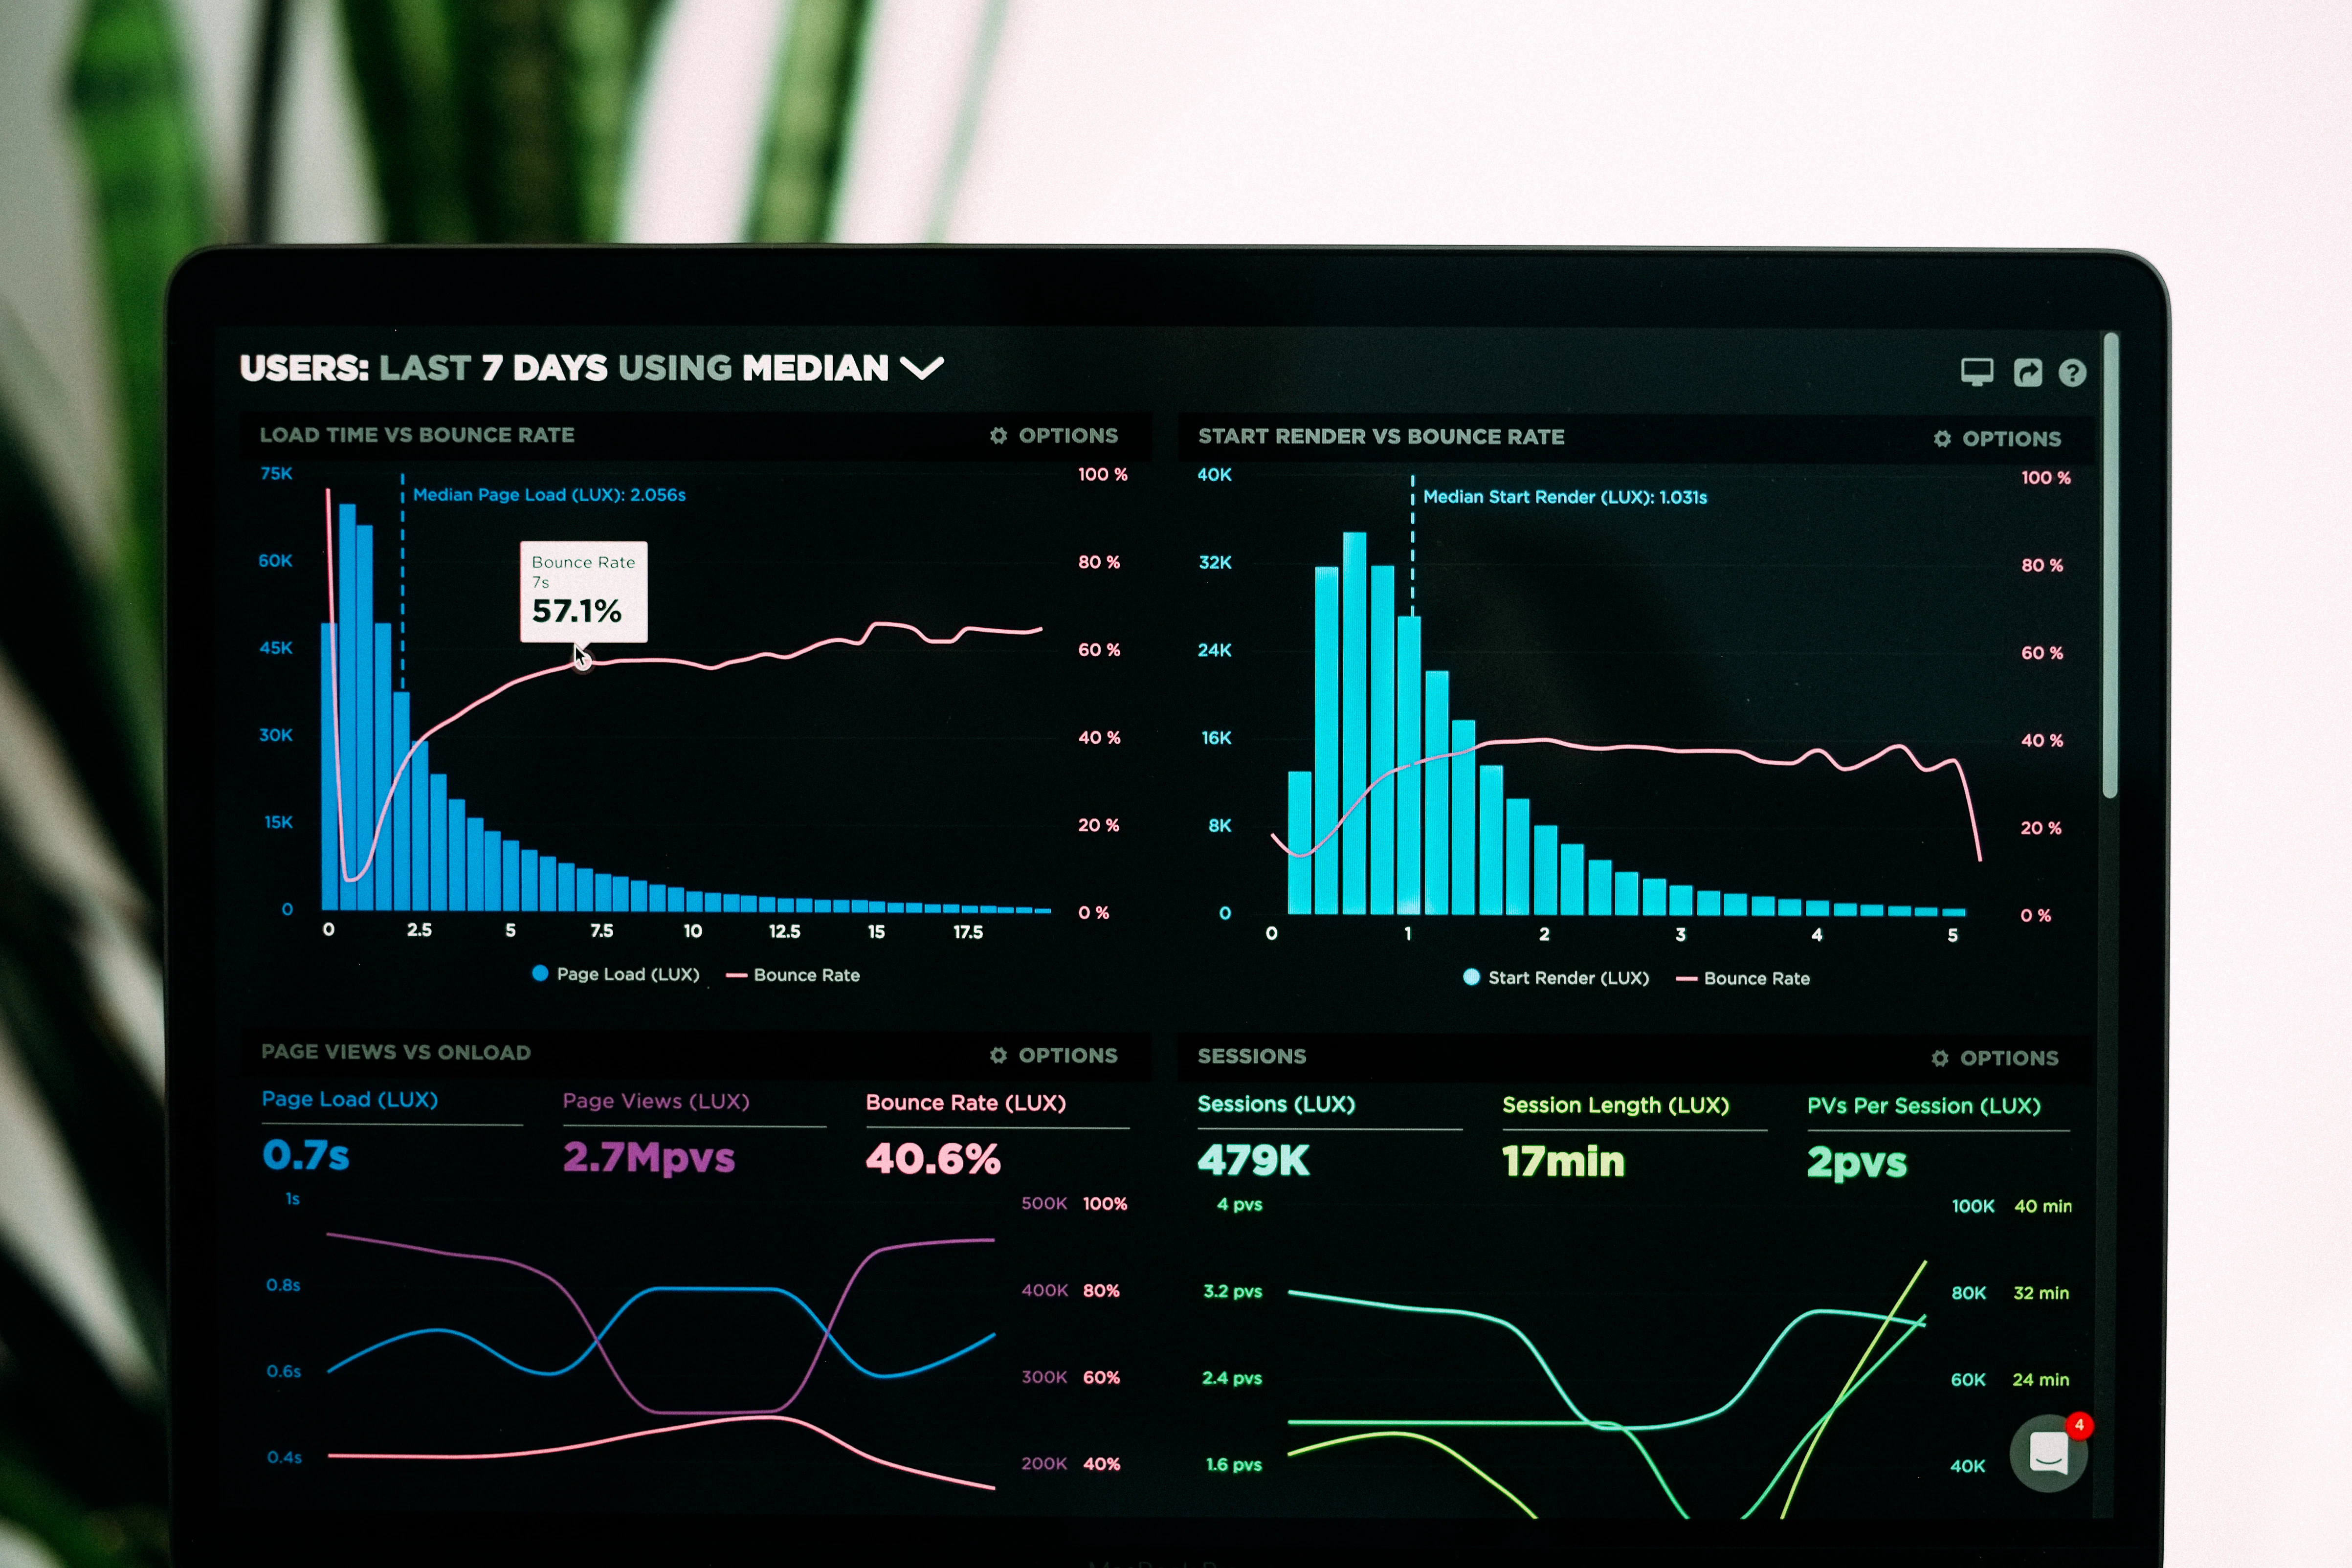
This sophisticated dashboard application provides businesses with powerful tools for data analysis and decision-making. The platform features an intuitive interface that displays complex data in easily digestible visual formats, including interactive charts, graphs, and real-time metrics. The dashboard includes customizable widgets, drag-and-drop functionality for layout customization, and the ability to create personalized views for different user roles. The application supports multiple data sources and provides real-time updates, ensuring that users always have access to the most current information. Advanced features include data export capabilities, automated report generation, and integration with various business tools and APIs.
Creating smooth and responsive data visualizations that handle large datasets efficiently
Implementing real-time data updates without affecting dashboard performance
Designing an intuitive user interface that makes complex data easily understandable
Optimizing React components for fast rendering and smooth user interactions
Implemented Chart.js with optimized rendering techniques and data chunking for large datasets
Used WebSocket connections and efficient state management to handle real-time updates seamlessly
Designed a clean, minimalist interface with progressive disclosure and intuitive navigation patterns
Applied React optimization techniques including memoization, lazy loading, and virtual scrolling
AI-powered analytics with LLM agents
Decentralized digital asset trading platform
Modern fashion retail platform with advanced features
Interactive data visualization and analytics platform
Professional visa services with CMS and Formspere
Explore my complete portfolio